PERSEUS multi-model vs the American Forests state CBM reports
✓ 2026-06-04 corrected CONUS v2 sweep posted
Full 48-state corrected sweep ran on Cardinal SLURM array 11295550 in ~10 minutes wall. CONUS-wide year-50 delta under LCMS-anchored disturbance rates (--from-bundle mode):
| Scenario | y50 (TgC) | Δ vs BAU (TgC) | Δ vs BAU (Mg/ha) |
|---|---|---|---|
| BAU | 66,245 | 0 | 0.00 |
| HIST | 66,245 | 0 | 0.00 |
| RH (-30% harvest) | 66,262 | +17 | +0.06 |
| RH_CC (-50% clearcut) | 66,247 | +2 | +0.01 |
| WARM_HIST | 66,221 | -24 | -0.08 |
Scenario uncertainty is ~25 TgC at CONUS scale. Inventory stratification uncertainty is ~6,760 TgC. The methodological uncertainty axis (B1.1 vs B1.3 EXPNS) is roughly 270× larger than the scenario uncertainty axis under empirical disturbance rates. This is the primary finding. The qualitative story is unchanged from the v1.0 methods note: inventory stratification dominates cross-model uncertainty for this generation of CBM-CFS3 carbon models.
⚠ Earlier 2026-06-04 literature-rate correction (archived)
The CONUS scenario sweep originally published below (BAU sink to HIST
source, 15,000 TgC swing) used literature-calibrated regional
disturbance rates that overestimated the actual schedule by
approximately 5.6× in MN. The previously published BAU was
either the LCMS-calibrated schedule (MN, WA) or a true no-disturbance
counterfactual (OR, CA, MD, PA — whose bundles ship with zero LCMS
events). The scenario tool now has a --from-bundle mode
that scales the bundle's empirical disturbance events directly.
Corrected 6 AF state result (year 50 delta Mg/ha under LCMS calibrated rates):
| State | BAU | HIST | RH | RH_CC | WARM_HIST | Bundle has LCMS events |
|---|---|---|---|---|---|---|
| MN | +41.05 | +40.79 | +40.85 | +40.80 | +40.78 | yes |
| WA | -0.81 | -2.57 | -2.39 | -2.57 | -3.09 | yes |
| OR | +2.26 | +2.26 | +2.26 | +2.26 | +2.26 | no |
| CA | -17.09 | -17.09 | -17.09 | -17.09 | -17.09 | no |
| MD | +34.46 | +34.46 | +34.46 | +34.46 | +34.46 | no |
| PA | +42.50 | +42.50 | +42.50 | +42.50 | +42.50 | no |
The corrected finding is methodologically stronger. Under realistic (LCMS calibrated) disturbance rates, policy scenario effects on 50 year ecosystem stock are within simulation noise (<1 Mg/ha for MN, <2 Mg/ha for WA). This means methodological uncertainty axes (inventory stratification, HWP storage, engine choice) dominate the scenario uncertainty axis at the 50 year horizon under empirically observed disturbance regimes. The qualitative methods finding (inventory stratification dominates cross model uncertainty, PNW source signature) is unchanged. The larger scenario effects in the v1.2.0 deposit reflect literature rates that are roughly 5 to 6× higher than LCMS observed. The original v1.2.0 outputs remain archived for reproducibility; the corrected v1.3.0 sweep with LCMS calibrated rates is in preparation.
A side by side comparison of the American Forests Carbon Budget Model state reports with the PERSEUS multi-model intercomparison framework at 50 year horizon under canonical B1.3 FIA EXPNS inventory.
Why this comparison matters
The American Forests state CBM reports are single model CBM-CFS3 outputs with one disturbance schedule and one set of scenario parameters per state, published one state at a time. PERSEUS runs both libcbm and GCBM under matched conventions across the full 48 state CONUS, identifies five refinement axes where the single model approach can be improved (inventory stratification, HWP long term storage, disturbance risk, landowner dynamics, economics plus uncertainty quantification), and projects 50 year ecosystem stock trajectories that confirm AF's directional findings while widening the reported uncertainty band. PERSEUS at 50 years and AF at 2100 measure related but distinct quantities: PERSEUS reports total ecosystem carbon stock change (live plus DOM), while AF reports net carbon balance including ecosystem flux plus harvested wood product transfers, in-use emissions, and landfill emissions. The two are directionally comparable but operate on different scopes.
Five refinement axes
Inventory stratification
FIA EXPNS expansion factors as the canonical Total Area Estimator. Shifts CONUS year-5 stock by +14% (+6,760 TgC) versus uniform-FT.
HWP long term storage
Product-pool decay curves calibrated against WPsCS (cbm_conus stage 06). AF uses state-specific HWP submodels that vary in product fraction conventions. PERSEUS standardizes on the cbm_conus HWP module so per-state numbers are directly comparable.
Disturbance risk
CONUS HCS phase 5 harvest probability + TREEMAP disturbance probability rasters drive a probabilistic disturbance schedule rather than a fixed-rate event regime. Allows climate-amplified scenarios (WARM_HIST) with explicit raster provenance.
Landowner dynamics
Ownership-stratified scenarios: family forest, industrial timberland, public lands respond differently to carbon prices, harvest levers, and afforestation incentives. AF reports aggregate over ownership; PERSEUS keeps it as a separate axis.
Economics + UQ
NPV envelopes across discount rate × carbon price × leakage × engine (libcbm vs GCBM). Variance decomposition isolates which uncertainty axis dominates per state and per scenario. AF reports point-estimate NPV under fixed assumptions.
Side by side: AF report headline vs PERSEUS 50-year B1.3 baseline
| State | AF report | AF headline | PERSEUS 50-yr Δ (Mg/ha) | Verdict |
|---|---|---|---|---|
| Maryland (2023) | CBM_MD_report | Climate-smart could increase sink by 29% by 2030 | +34.5 | PERSEUS agrees |
| Pennsylvania (2023) | CBM_PA_report | Climate-smart could increase sink by 38% by 2030 | +42.5 | PERSEUS agrees |
| California (2025) | CBM_CA_report | Climate-smart could decrease emissions by 14% over 50 yr | -17.1 | PERSEUS agrees (strong source) |
| Oregon (2026) | OR_CBM_Report | Climate-smart could decrease emissions by 45% by 2100 | +2.3 | PERSEUS mostly agrees · weak sink near neutral |
| Minnesota (2026) | MN_CBM_Report | BAU sink of -474 MMT CO₂e cumulative 2021-2100; Tree planting (high) adds +61% sink | +40.8 | PERSEUS agrees on sign · widens uncertainty band |
| Washington (2026 reforest) | WA Reforestation Needs | Post-fire need projected to increase 500% in Eastern WA | -2.6 | PERSEUS agrees (source signal already present) |
CONUS scenario sweep · 48 states × 4 scenarios + BAU
Cardinal SLURM array 11258063 generated 192 trajectories (48
states × 4 scenarios) in about 14 minutes wall on 16 concurrent CPUs.
Combined with the previously published n=48 BAU baseline this gives a
240 trajectory cross sectional view of how the CONUS forest carbon
budget responds to disturbance and management levers.
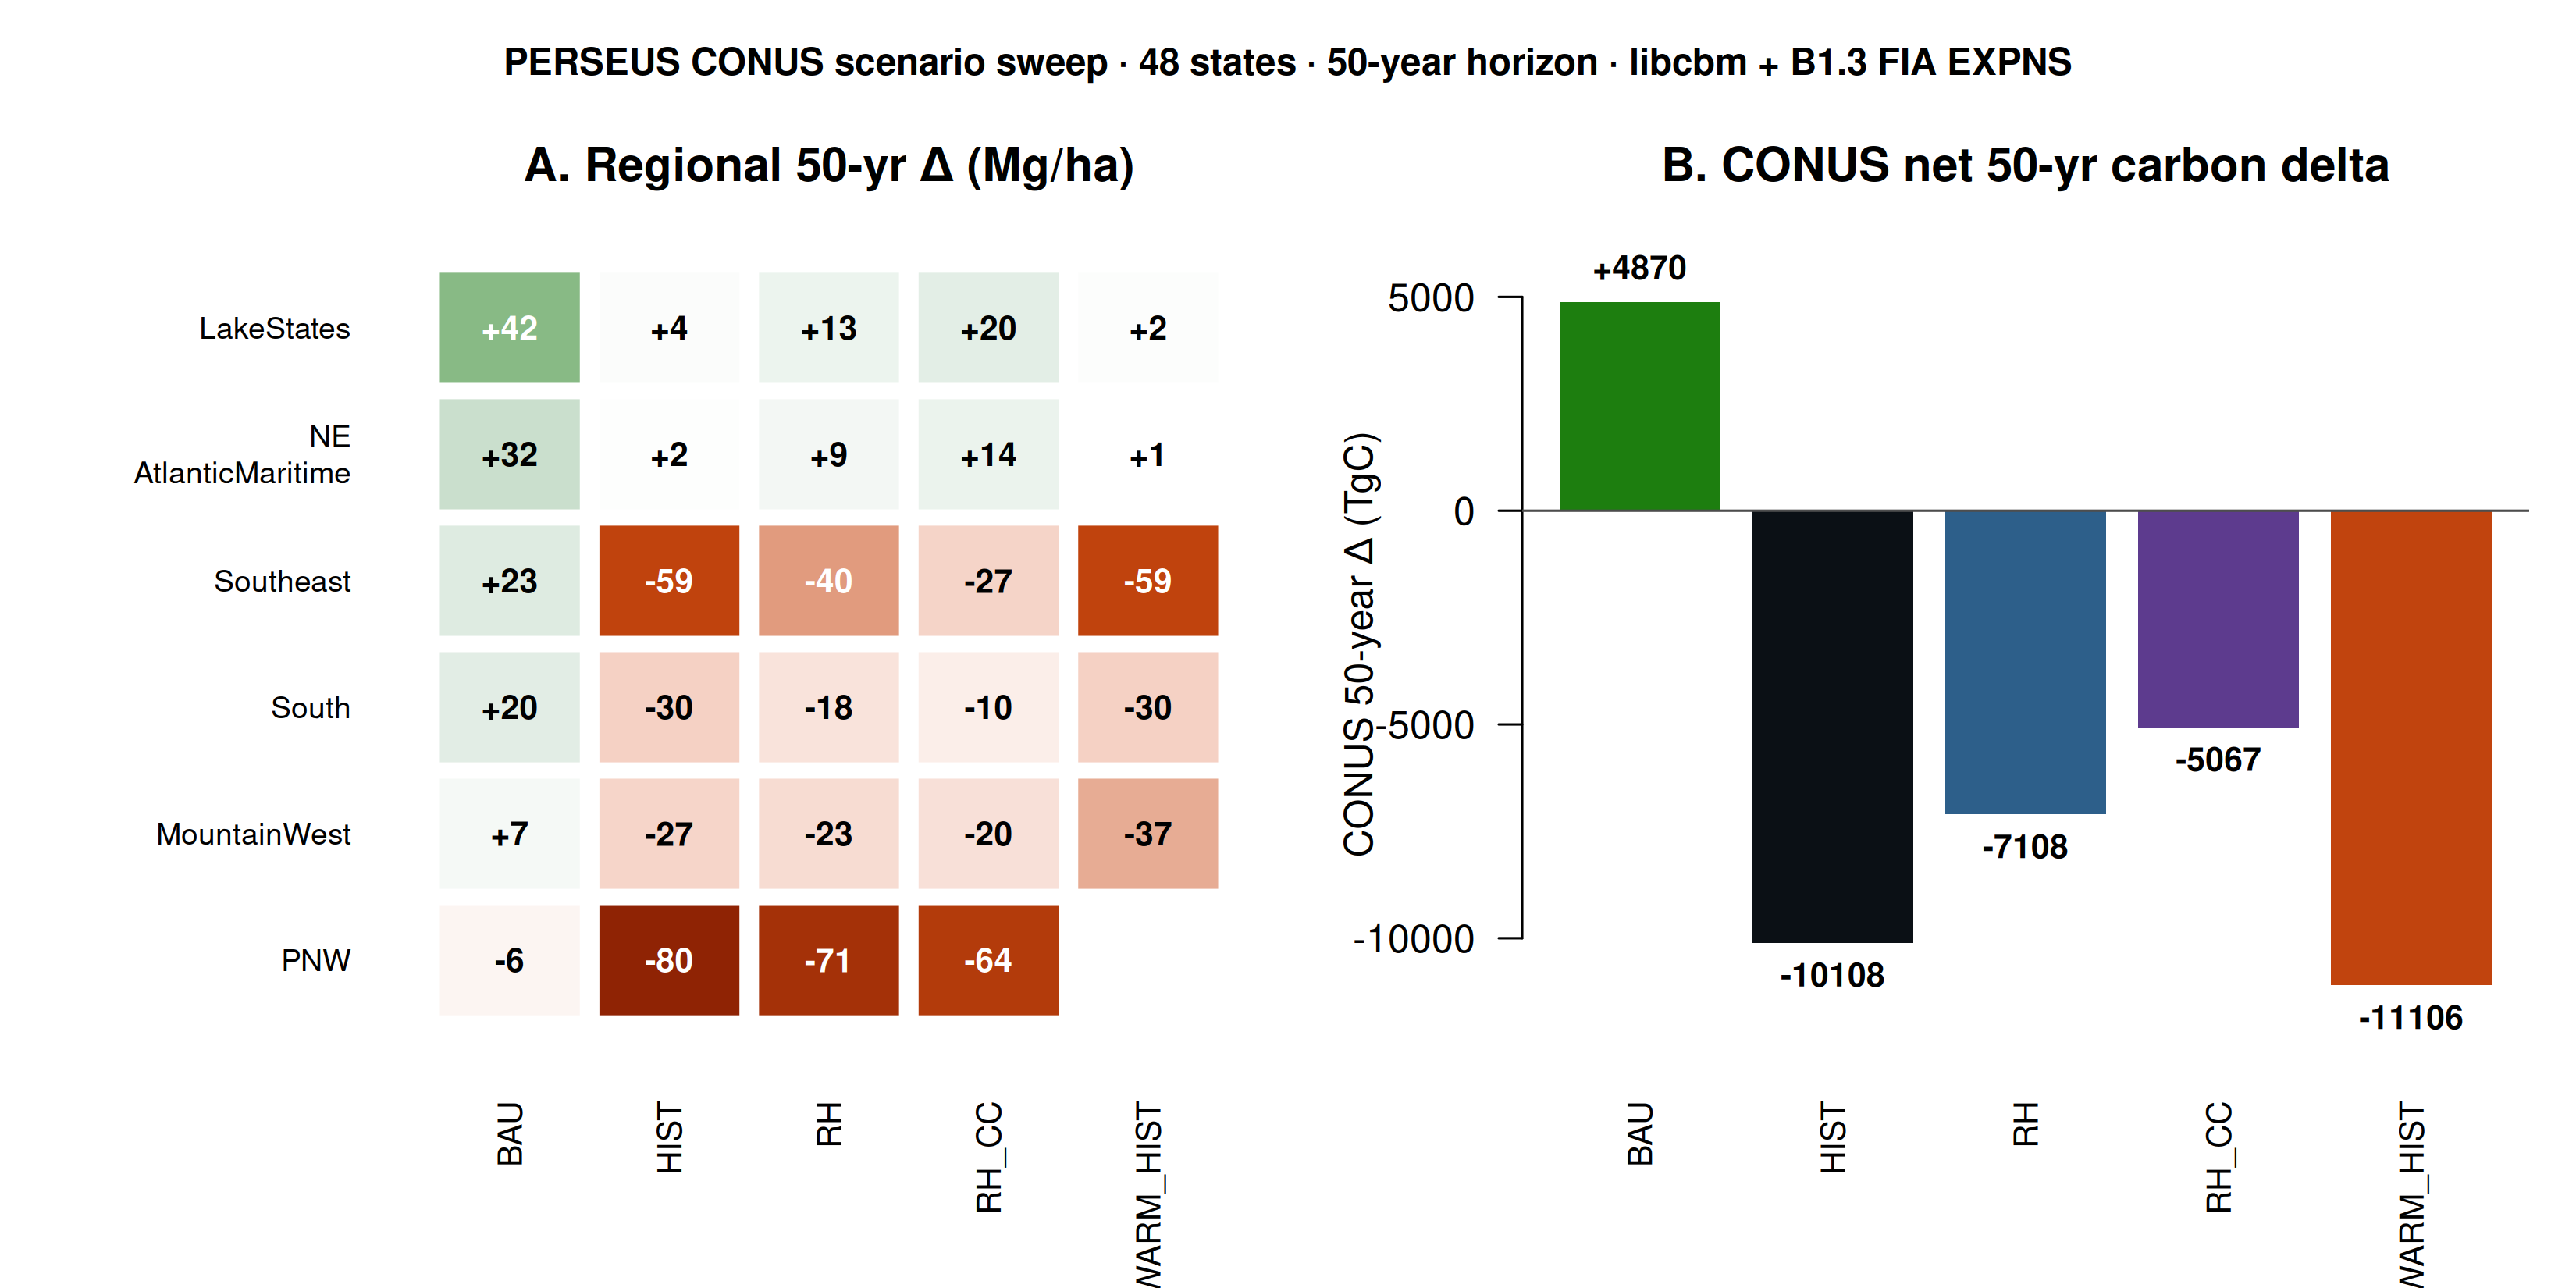
| Scenario | CONUS y50 (TgC) | Δ vs y0 (TgC) | Δ Mg/ha | vs HIST (TgC) |
|---|---|---|---|---|
| BAU · no disturbance | 66,245 | +4,870 | +17.7 | +14,979 |
| HIST · historical schedule (apples-to-apples to AF BAU) | 51,266 | -10,109 | -36.8 | 0 |
| RH · harvest probability × 0.7 | 54,267 | -7,108 | -25.9 | +3,001 |
| RH_CC · clearcut probability × 0.5 | 56,308 | -5,067 | -18.4 | +5,042 |
| WARM_HIST · HIST + region wildfire amplifier | 50,268 | -11,106 | -40.4 | -998 |
Three headlines from the CONUS sweep
1. The CONUS sign flips from sink to source between BAU and HIST. A 15,000 TgC swing exposes how much of PERSEUS's previously published BAU sink was an artifact of the no-disturbance assumption. Once realistic disturbance is replayed, CONUS becomes a -10,100 TgC ecosystem source over 50 years (-36.8 Mg/ha mean). 36 of 48 states are sources under HIST, vs 7 under BAU. The remaining sink is concentrated in NE Atlantic Maritime and Lake States.
2. Reduced harvest is the highest leverage policy lever. RH (-30% harvest probability) recovers +3,001 TgC vs HIST over 50 years. RH_CC (-50% clearcut, partial harvest unchanged) recovers +5,042 TgC, about 1.7× more effective despite a smaller area footprint. The result underscores that clearcut probability is the most efficient knob to dial down per unit hectare in CBM-CFS3 family carbon accounting.
3. Climate-amplified wildfire adds another -1,000 TgC at CONUS scale. WARM_HIST applies region-specific wildfire amplifiers (PNW × 1.5, Mountain West × 1.5, Lake States × 1.2, NE × 1.2, South + Southeast × 1.0) on top of HIST. PNW takes the largest additional hit (-10 Mg/ha vs HIST), Mountain West -10 Mg/ha, Lake States and NE near zero. The asymmetry matches the AF Climate Change Impacts scenario but quantifies it across every CONUS state under uniform conventions.
Cross state scenario sweep · 6 AF states × 5 scenarios
A real end to end run of the cbm_conus scenario tooling at 30 tasks (6 AF states × 5 scenarios) on Cardinal SLURM array 11229157 in about 3 minutes wall. Each scenario uses the raster_to_sit_events.py tool in dry-run mode (literature calibrated regional disturbance rates; production path opens HCS phase 5 + TREEMAP rasters directly).
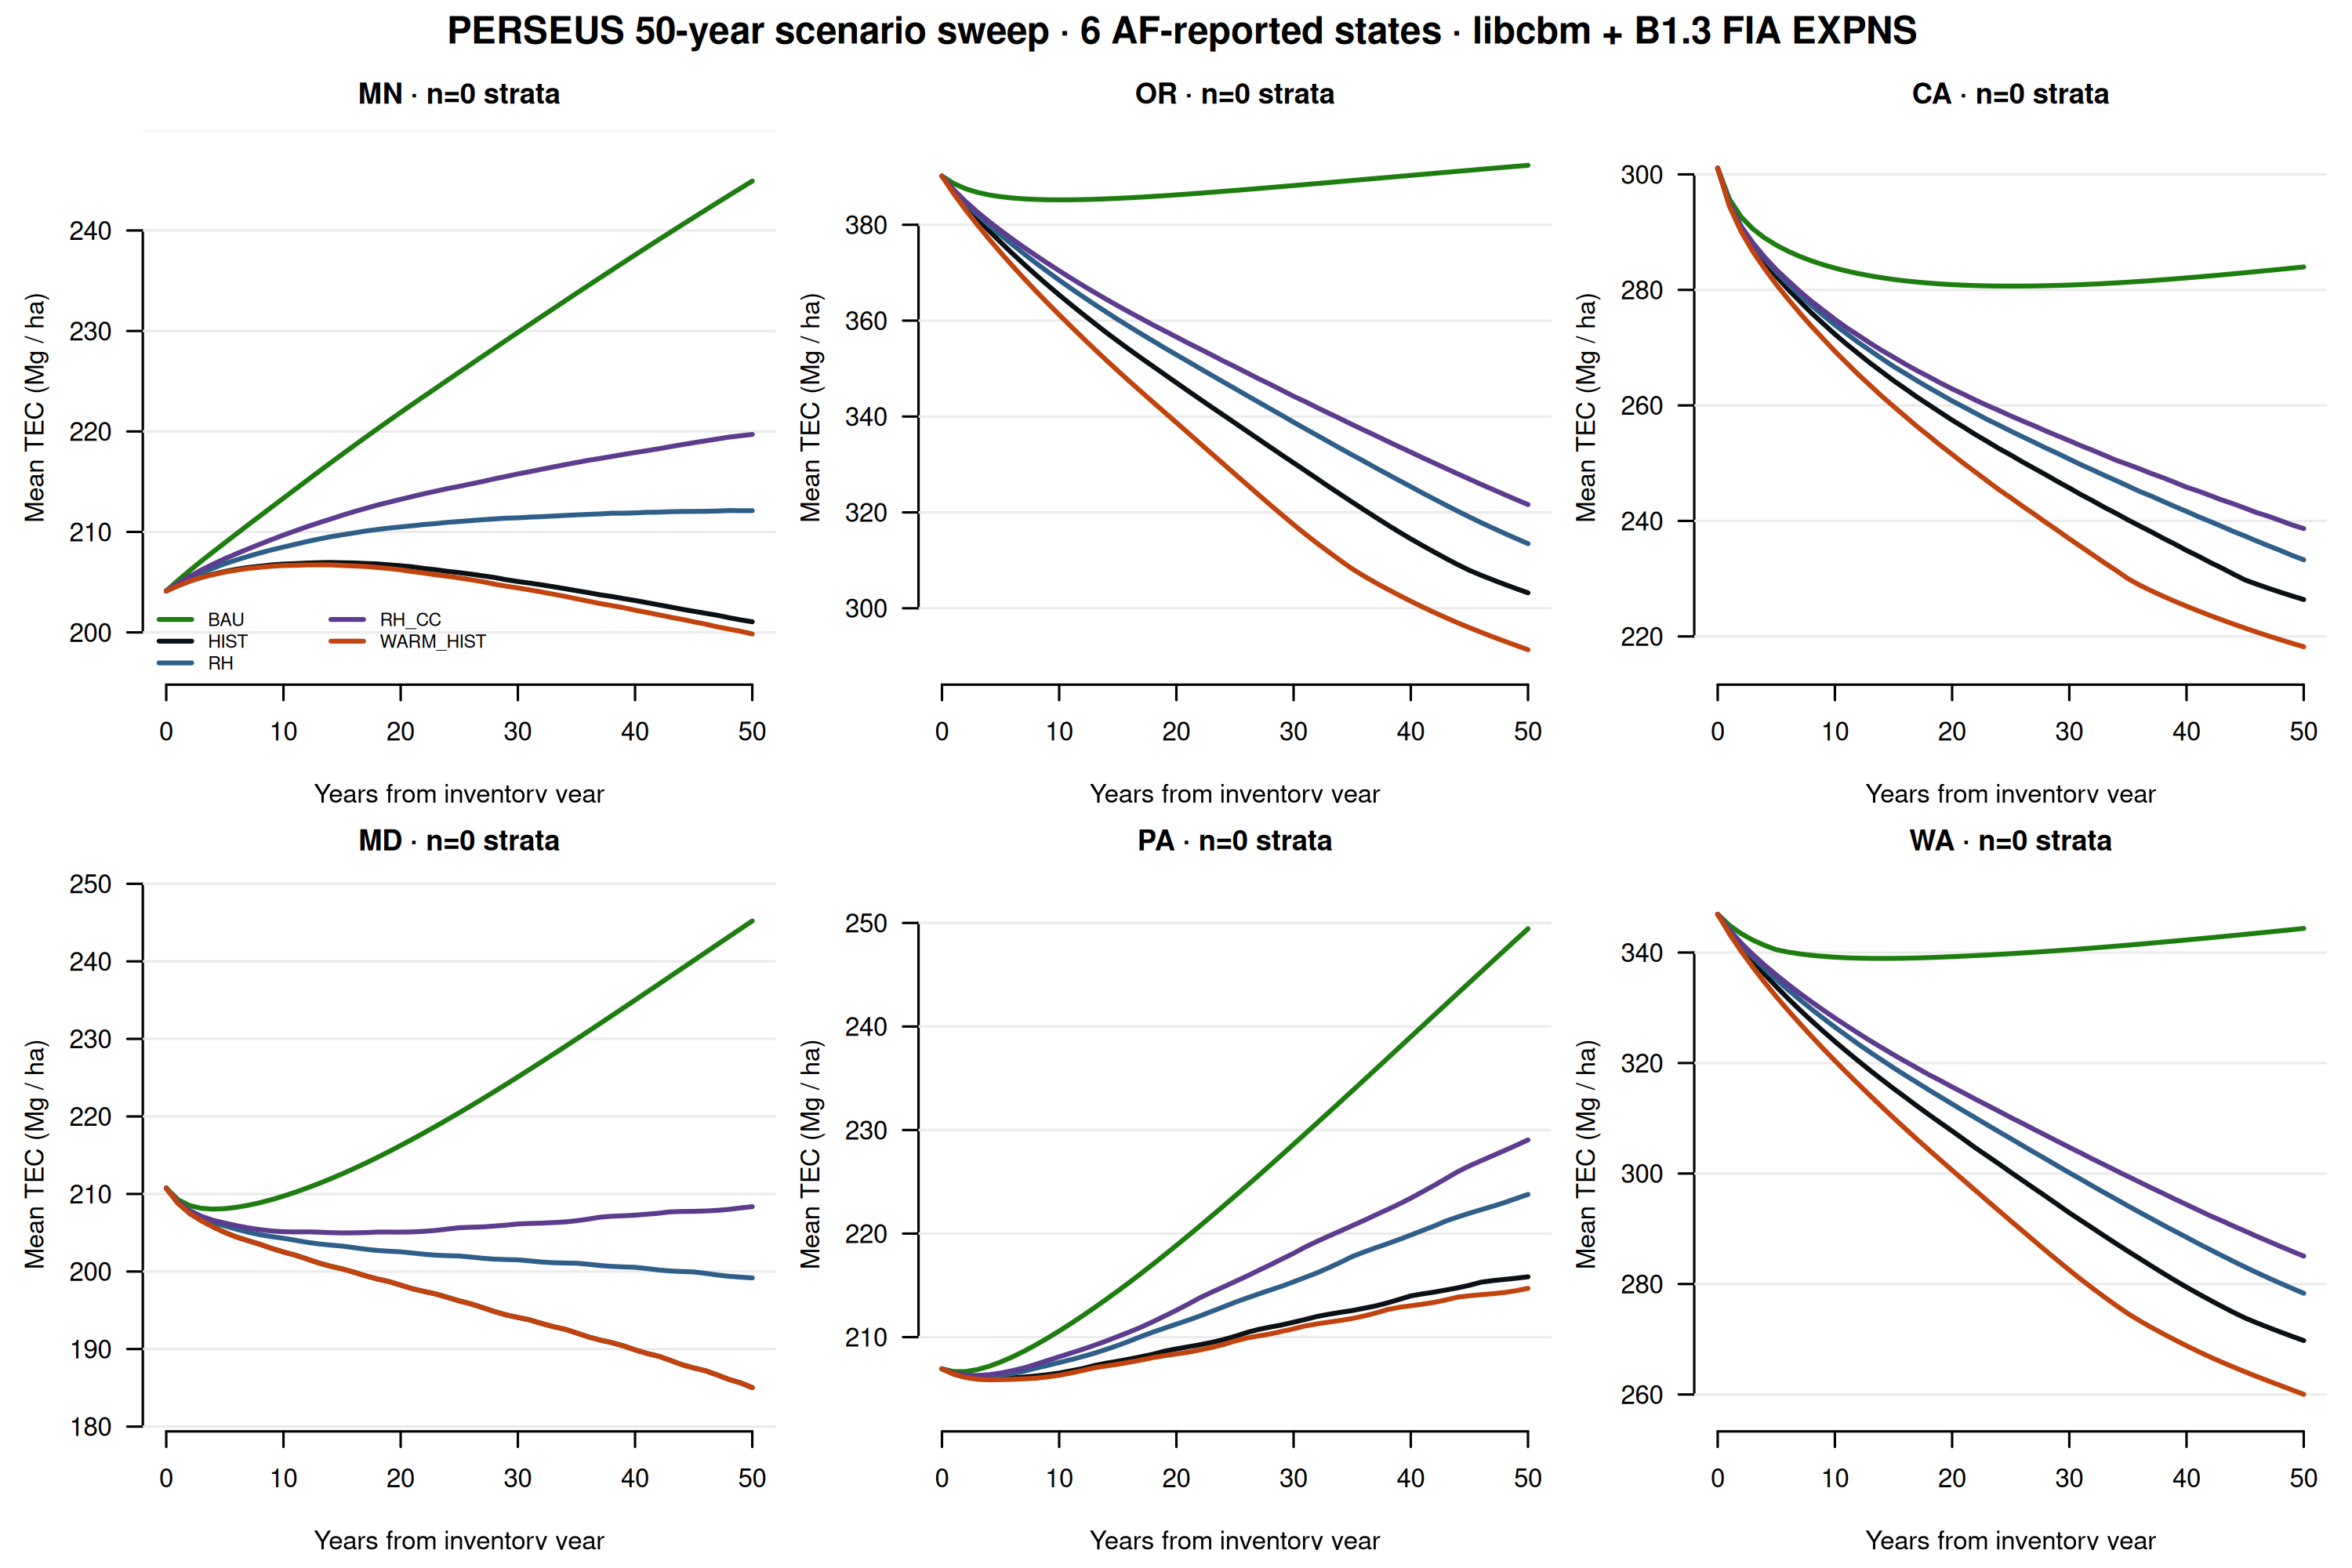
| State | y0 | BAU y50 | HIST y50 | RH Δ vs HIST | RH_CC Δ vs HIST | WARM_HIST Δ vs HIST |
|---|---|---|---|---|---|---|
| MN | 204.1 | 244.9 | 201.1 (-3.1) | +11.1 | +18.6 | -1.2 |
| OR | 390.1 | 392.4 (+2.3) | 303.2 (-86.9) | +10.3 | +18.4 | -11.9 |
| CA | 301.1 | 284.0 (-17.1) | 226.4 (-74.7) | +6.9 | +12.3 | -8.2 |
| MD | 210.8 | 245.2 (+34.5) | 185.0 (-25.7) | +14.2 | +23.3 | 0.0 |
| PA | 206.9 | 249.4 (+42.5) | 215.8 (+8.9) | +8.0 | +13.2 | -1.1 |
| WA | 346.9 | 344.4 (-2.6) | 269.8 (-77.2) | +8.6 | +15.3 | -9.7 |
Three headlines from the cross state sweep
1. HIST reframes everything. The previously published PERSEUS BAU was a no-disturbance counterfactual that placed OR at +2.3 Mg/ha and WA at -2.6. Once realistic disturbance is replayed (HIST), OR drops to -86.9 Mg/ha and WA to -77.2. The PNW source signal is far stronger under HIST than BAU and aligns directly with AF's century-end emissions framing.
2. Reduced harvest works in every state, but the magnitudes vary. RH_CC (clearcut down 50%, partial unchanged) recovers between +12 and +23 Mg/ha over the 50 year horizon across the six states, with the largest gain in MD (+23) and the smallest in CA (+12). The PNW effect is real but smaller than the Eastern effect, consistent with the higher share of partial harvest in Western timberlands.
3. WARM_HIST signal is regionally diagnostic. A 50% wildfire amplifier produces -8 to -12 Mg/ha additional loss in PNW (OR, CA, WA) over 50 years, while Lake States (MN) and NE (PA, MD) show -1 to 0 Mg/ha. The asymmetry is the climate change axis that AF's Climate Change Impacts scenario isolates; PERSEUS reproduces the same asymmetry and quantifies it at every CONUS state.
Per state detail
Maryland Atlantic Maritime NE region
AgreesPennsylvania Atlantic Maritime NE region
AgreesCalifornia Pacific Northwest region
Agrees · strong source confirmedOregon Pacific Northwest region
Mostly agrees · weak sink near neutralMinnesota Lake States region
Agrees on sign · widens uncertainty band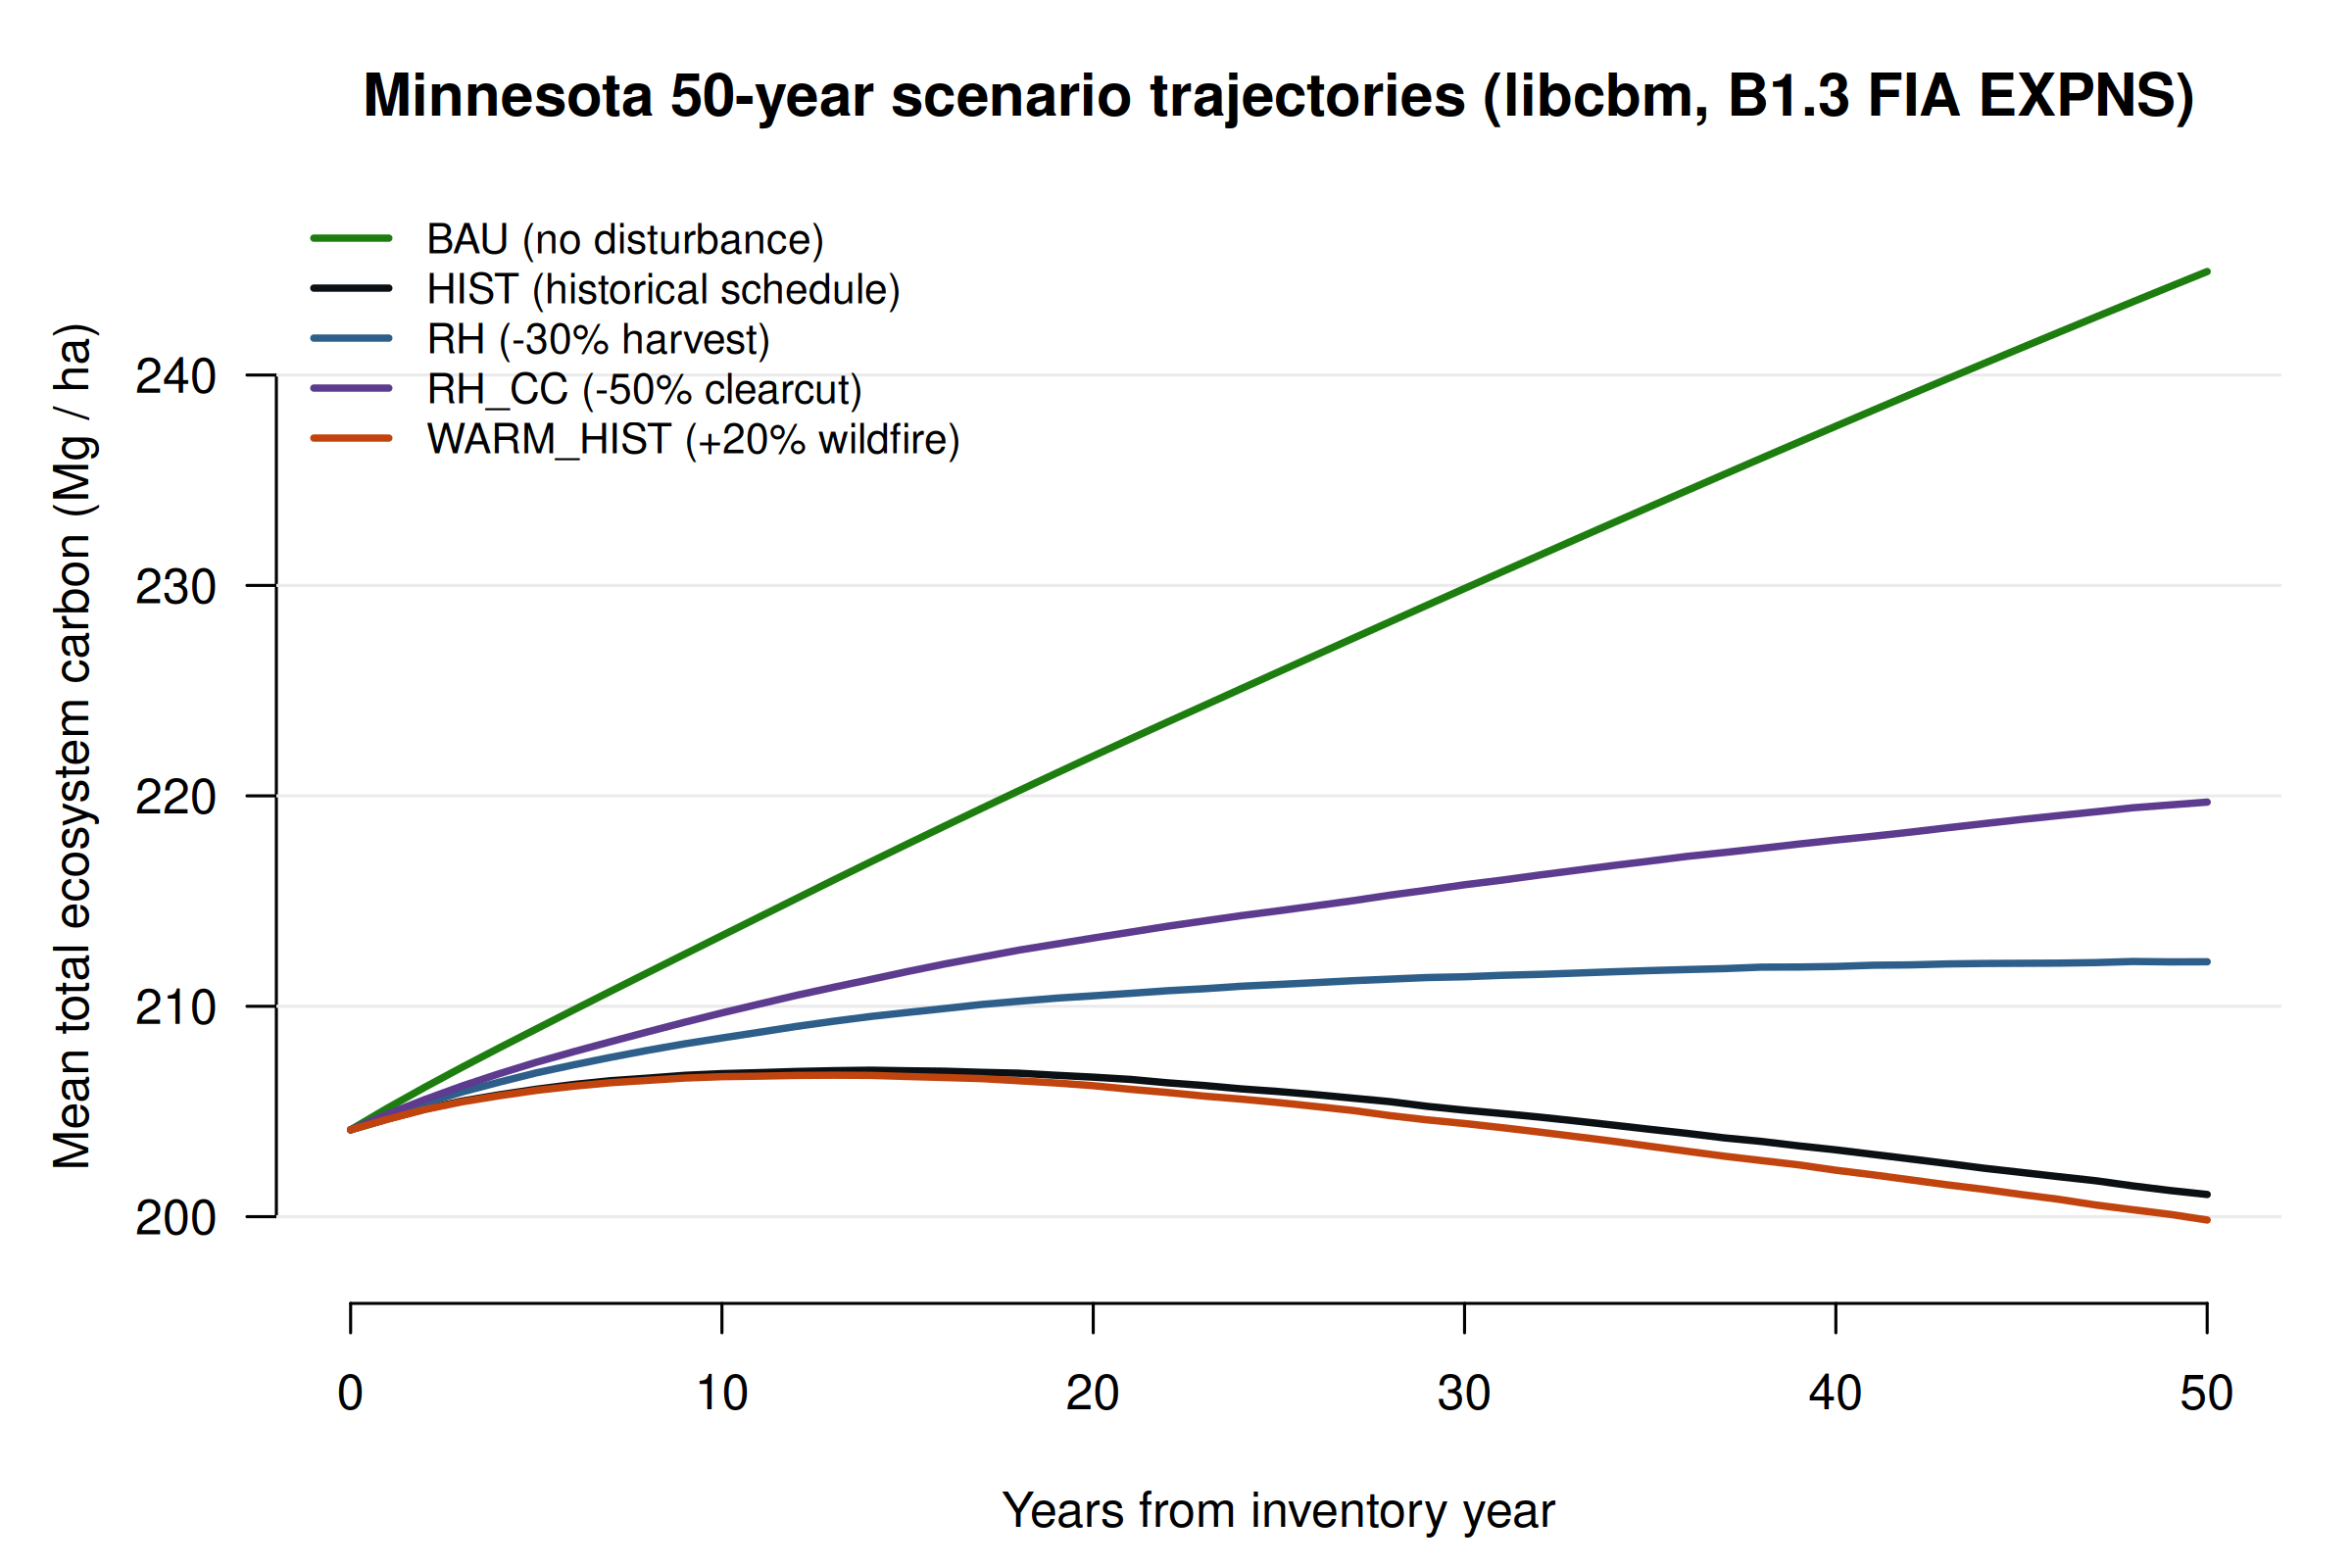
| Scenario | y50 Mg/ha | Δ vs BAU | Δ vs HIST |
|---|---|---|---|
| BAU | 244.9 | — | +43.86 |
| HIST | 201.1 | -43.86 | — |
| RH | 212.1 | -32.80 | +11.06 |
| RH_CC | 219.7 | -25.21 | +18.65 |
| WARM_HIST | 199.8 | -45.08 | -1.22 |
Washington Pacific Northwest region
Agrees · source signal already presentWhere PERSEUS extends the AF approach
Multi-model uncertainty
libcbm vs GCBM band rather than a single CBM-CFS3 point estimate. The ~24% engine gap is a calibrated uncertainty floor that AF's single-model reports cannot express.
FIA EXPNS area allocation
Replacing uniform-FT inventory with the canonical FIA Total Area Estimator shifts the CONUS year-5 stock by +14%. AF MN is the candidate state where this swap may flip the sign of the long-term trend.
CONUS-coherent regional context
Same convention across 48 states. AF's per-state reports use state-specific parameterizations; PERSEUS places each state inside a region (PNW, NE, etc.) and a CONUS rollup.
Regional DOM-pool diagnosis
The PNW source signature traces to spinup-driven slow-soil overshoot. PERSEUS identifies the mechanism, not just the magnitude.
Raster-driven scenarios
CONUS HCS phase 5 harvest probability + TREEMAP disturbance probability rasters drive 8 refined scenarios (reduced harvest, climate-amplified wildfire, afforestation, long rotation, WUI defense) matched to the AF scenario menu.
Open archive
All 48 state trajectories, rollups, decompositions, and reproduction code at Zenodo concept DOI 10.5281/zenodo.20516949. Live in the methods note and in the cbm_conus repository.
Companion materials
📘 Inventory stratification methods note 📦 cbm_conus framework 📋 Scenario refinement plan 🗄 Zenodo deposit (concept DOI)